“Create dashboards to monitor KPIs…” This is often my answer to a question I regularly get from business people: what can you do with Python? Let me walk you through a simple example for my own business. This time with Google Cloud.
Google Data Studio
Let’s start with the end in mind: we want to see our data visualised. Google launched their data visualisation tool called “Data Studio” in 2018. It is their answer to the growing demand for visualisation software like Microsoft’s PowerBI or Tableau. While it might not be the most used tool out there, it obviously integrates nicely with the other products from the Google stack. For this example I create two charts for KPIs that are important for my business. Firstly, the number of new students per month. Secondly, the average rating of the reviews on TrustPilot. Where is this data coming from you might wonder. Easy! It is collected by Python scripts…

Google Cloud Functions
“Cloud Functions” are part of the “Cloud Platform”. You can create small scripts in that will run when they are triggered. In this case, the trigger is the clock, because I let them run every morning at 5AM. So every day, a script runs to count the number of students (in my PostgreSQL database) and one to scrape TrustPilot.

You can just copy & paste your script in the editor on the website. Don’t forget to include the packages you are using (like requests or pandas) in “requirements.txt”. Hit the DEPLOY button and you are good to go!

Google Sheet
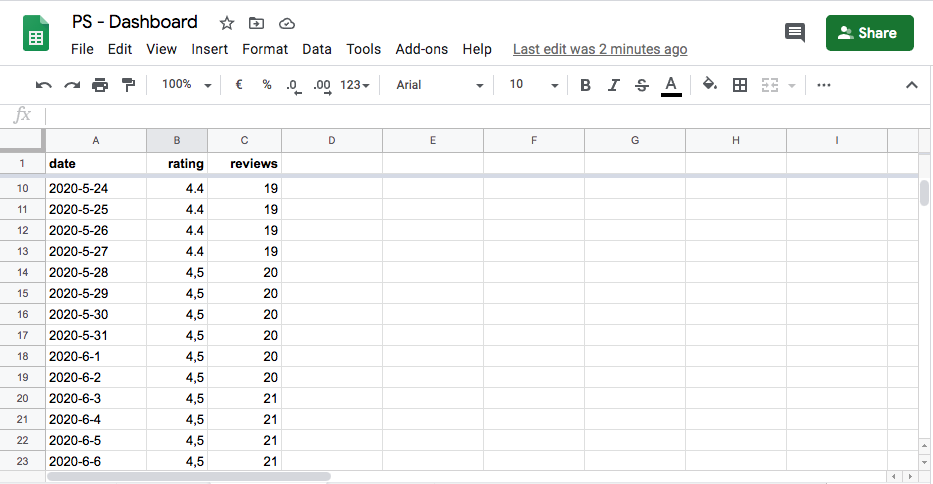
The script in this particular example writes data to a Google Sheet. You might as well write it to BigQuery if you expect more data. The procedure is pretty much the same and won’t cost you any more effort.
Conclusion
Finally, as you can see, the whole setup is fairly easy and straightforward. Furthermore, after you set it up you don’t really need to do anything anymore. Just enjoy the real time data on your KPIs!. Hopefully this example helps you better understand what you can do with Python. If you are interested in learning more, please feel free to check out the Advanced: Automated Dashboards course. The dashboards are just one of the gazillion possible things you can do with Python, so the next time I’ll write about another example.
Happy coding!